Chromatic aberration measurement and correction
Contents |
What is Chromatic Aberation and why should I care about it?
A big issue in multi-color fluorescence microscopy is chromatic aberration and mis-registration: The precise spatial overlay, or "registration" of the single color channels. This becomes especially important for pixel-precise colocalization analysis.
More detailed descriptions are found elsewhere: Wikipedia Chromatic Aberration.
For accurate colocalisation measurements, and for the best visual image quality, measuring the chromatic aberration present and correcting the images for it before performing colocalisation analysis makes very good sense, especially for high resolution objectives. Several points must be considered for the best overlay of color channels in the imaging hardware itself:
- coupling of the lasers: often "UV" and "VIS" lines have separate couplings due to the necessity for different fibers; the coupling precision influences the registration of "UV" and "VIS" lines
- collimator lenses: various systems allow to further influence the overlay of "UV" and "VIS" via collimator lenses
- objective lens chromatic corrections: the level of correction for chromatic abberations varies between objective types: A-Chromat, ApoChromat, PLAPO, UPLSAPO etc.
- objective lens damage: the correction of objectives can be ruined by objective damage.
- pinhole registration: on systems with multiple pinholes such as the Zeiss LSM 510, one might run into the additional trouble of pinhole alignment; if the pinholes are not well registered to each other, signals get displaced
Now it's clear that several combinations of acquisition settings should be tested. A good start is a stack of 3 colors (RGB, i.e. EX 405, 488, 561 nm) with open pinhole(s).
Sadly, not all objective lenses were made equal.
In our hands on point scanning confocals, even when you align the pinhole(s) as best you can there can still be a micron of misalignment in between "green", "red" or "far red", with DAPI etc. often being way off, as it comes through a different optic fiber and collimator anyway (eg on an LSM 510)
We have tested different lenses of the same spec from the same manufacturer, and found that they all have their own personality. Good correction is very possible, but "good" is a relative thing.
We send back ones that are too "bad", and keep the "good" ones. We take z stacks of 1 micron multi colour beads to measure the remaining error (dont need sub resolution bead images for this measurement)
There will always be a significant error, even in the very best "Super-dooper Mega Extra Apo-Chromat" lens you can get from any manufacturer for less than 100 k dollars. They simply can not be made perfect at a reasonable cost (as explained to us by a Zeiss lens guru)
If you want to do precise colocalization studies at the highest optical resolution (everyone does, even if they don't immediately realize it) then you simply MUST measure the error, then correct/shift the images (in 3D) before colocalization/correlation analysis.
This can be done in 3D in ImageJ/ Fiji using nice interpolation methods from Erik Meijering, for sub pixel shifts - TJ-Translate : http://fiji.sc/TransformJ leading to http://imagescience.org/meijering/software/transformj/translate.html
or in the great colour shift corrector of Huygens Professional (no commercial interest - just a happy customer) http://www.svi.nl/ChromaticShiftCorrector
or roughly in the Zeiss AIM 510 software in xy only (whole pixel shifts),
The effect on the 2 channel scatterplot / 2D histogram / fluorogram is very significant. A ugly poorly correlated cloud turns into tight correlated populations of pixels, and the coloc. coefficients jump much higher.
How to measure Chromatic Aberration
These instructions are optimized for point scanning confocals, but a similar procedure will work on any multi color fluorescence microscope system, be it widefield, spinning fisk, TIRF, or whatever.
requirements
- 200, 500 or 1000 nm multi color fluorescent beads sample
- no need to use sub-resolution beads here, signal to noise is more important, and localization is still precise.
acquisition
- open pinhole(s)
- use high resolution apochromatic objective (NA 1.2 or above)
- set up beam path for Z-stack RGB fluorescence (i.e. EX 405, 488, 561 nm)
- take care of pixel size and Z-step size (optimal sampling, i.e. pixel size 100 nm, step size 200 nm)
- do not oversaturate pixels, rather go for 12/16 bit
- use sequential line-by-line scanning, to reduce both bleed-through and influence of stage/system vibrations
- set the margins of the stack to cover the beads and the majority of the point spread function
- stay in the center of the field of view (optimal performance of scanner and objectives)
- acquire stack of images
analysis
- load the acquired stack into Fiji
- X-shift
- select the main focal plane
- draw a horizontal line with the line tool across a single bead close to the center
- get a straight line by holding down the shift key while drawing
- the line can be moved around with the arrow keys
- go to Analyze > Plot Profile
- go to the next channel w/o changing the line and plot another profile
- compare the peak of the profiles; or click on List and compare the peak values
- Y-shift:
- repeat the line drawing and profile plotting for the vertical direction
- Z-shift:
- remove the line
- draw a square around the same bead
- generate XZ-stack of that bead: Image > Stacks > Reslice...
- select the plane of interest, with a clear cut through the PSF of a bead
- draw a straight vertical line across the center of the bead
- plot the profile: Analyze > Plot Profile
- repeat that for the other channels
images
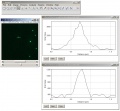
coregistration analysis in Fiji, 200 nm beads, 2 line profiles (X-direction) for "blue" and "green"
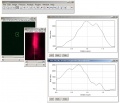
coregistration analysis in Fiji, 200 nm beads, 2 line profiles (Z-direction) for "green" and "red", Z-shift of ~250 nm visible
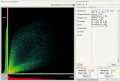
Scatterplot / 2D intensity histogram and Colocalization stats before color shift correction
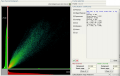
Scatterplot / 2D intensity histogram and Colocalization stats after color shift correction


