How to deconvolve images using Huygens
From BioDIP
Contents |
Introduction
This page is a quick user guide in how to apply deconvolution to images using the Huygens software from SVI[1]. It is divided into several parts:
- Firstly after imaging, you need to prepare Huygens to deconvolve your images.
- Secondly, you should determine the point spread function (PSF) of your imaging setup and a well fitting Huygens configuration for optimal deconvolution. This may take some time. Be patient. Explore possibilities of the software and make a wise decision on how to use it.
- Last but not least, you can do the actual deconvolution of your data.
Prerequesites
- Imaging: To apply deconvolution to fluorescence microscopy images, it is recommended to image your sample together with beads of the same wavelength (colour) as the flurophore used in your experiments. This is neccessary to determine the PSF of the imaging setup. If it is not possible to image beads and sample together in one shot, it is recommended to image both under identical conditions. Don't switch magnification, immersion medium or configuration of the microscope. Ensure that pixel/voxel size of all imaged samples and the beads are equal (also in Z!).
- Computer: To connect to the huygens server, you need a computer with linux or MacOS operating system.
- Just for the tutorial: Download example data. In the following, we will assume that you took at least one image (e.g. File:Bead Image1.lsm.zip) showing beads. Furthermore, another image shows the sample you would like to deconvolve File:DeconvolutionSampleVerticalGrid1AU.lsm.zip
Preparation
- If you want to work with Huygens from within the MPI CBG, you find information on how to connect and import data here: [2]
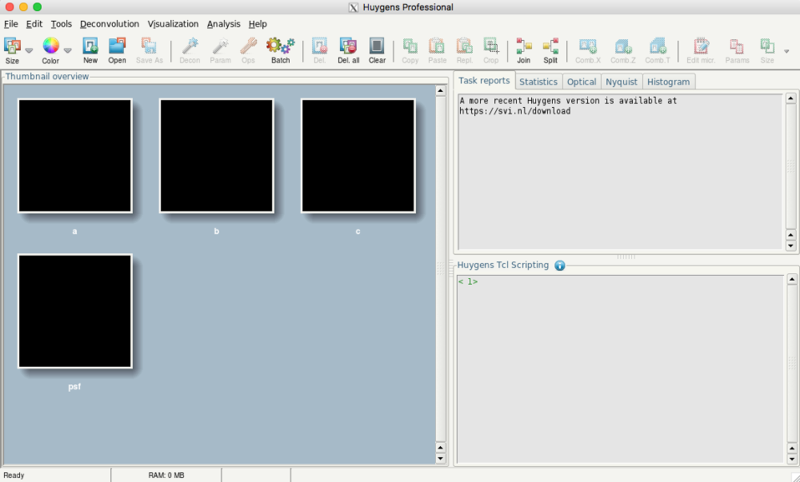
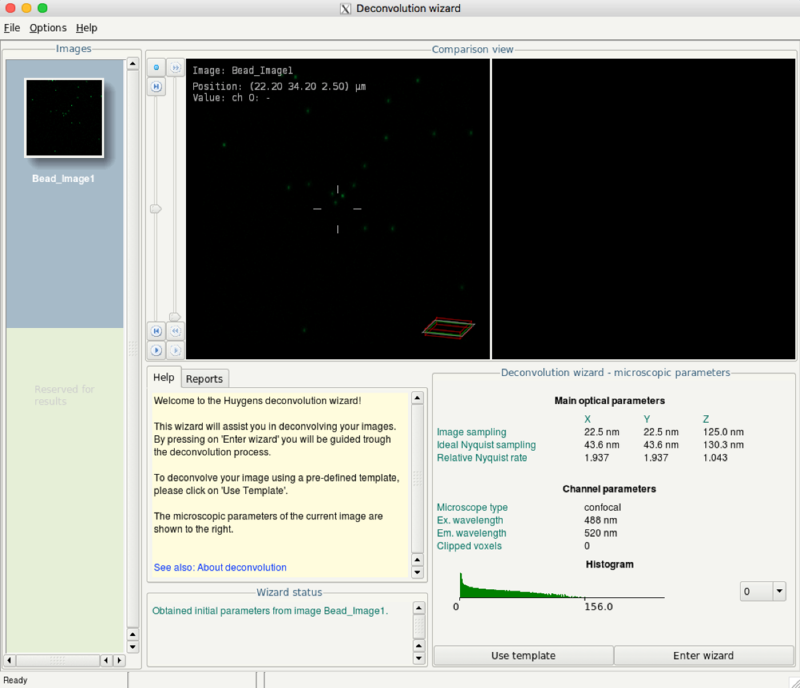
- The user interface will open:
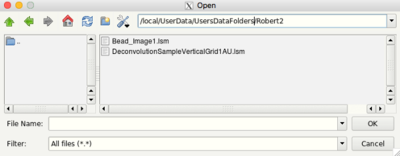
- Click the menu File > Open
- Select all files and click OK.
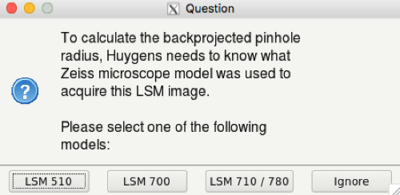
- Huygens will ask for the micrsocope model used for imaging. Select the right one (ask your trusted microscopist, if you don't know):
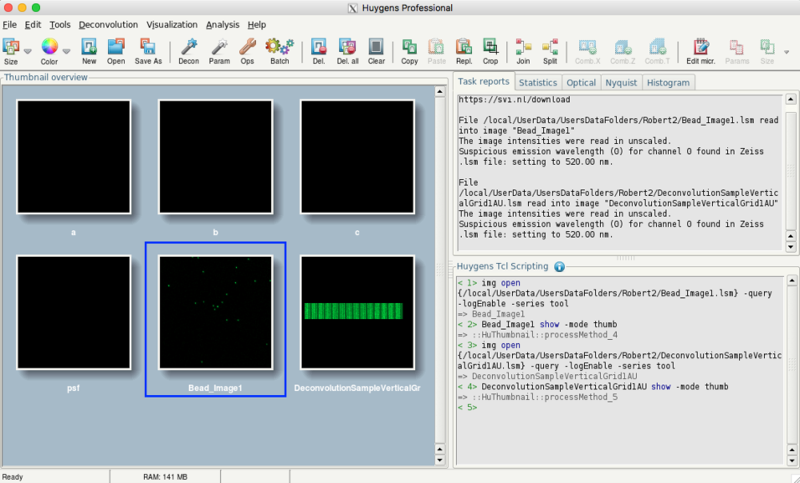
- Afterwards, the main window should show your images
Huygens is now ready to 1) determine the point spread function (PSF) of your imaging setup, and afterwards 2) deconvolve your images.
Determine the point spread function of the imaging setup
Before you can start with deconvolution, the PSF needs to be estimated. In Huygens this is done by averaging images taken from fluorescent beads.
- Select the bead image
- Click the menu Deconvolution > PSF distiller wizard
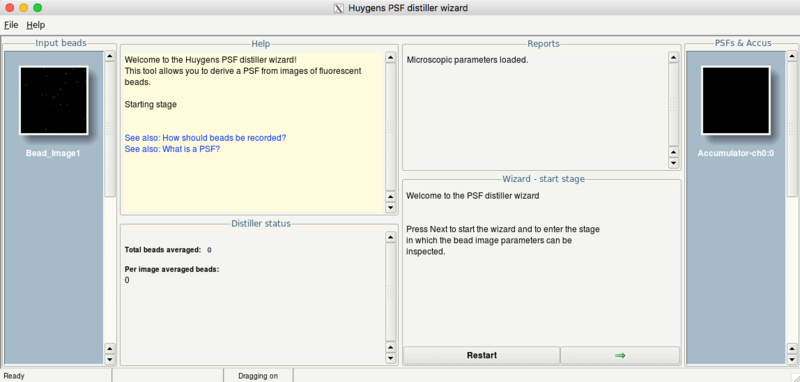
- Press the Next button (green arrow) to start the wizard
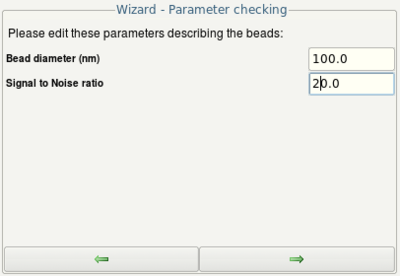
- Check the parameters (given by the meta data of your image) and continue by clicking the Next button
- Enter the size of the beads (given on the packaging of the beads)
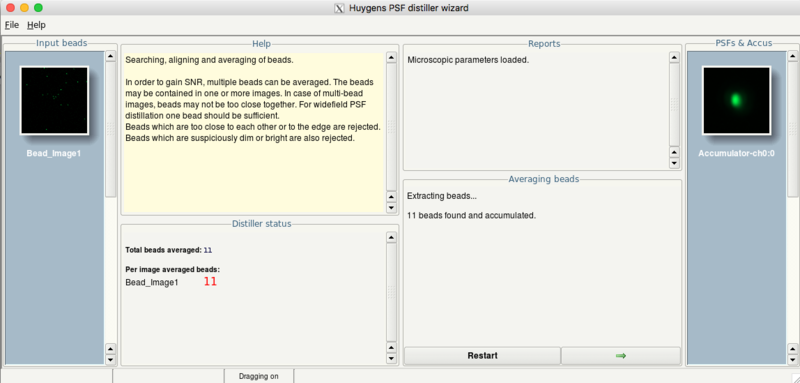
- Huygens will show afterwards the number of beads which can be averaged:
- Click on the Next button
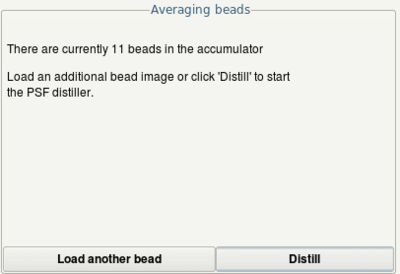
- Optionally, you can add more beads using the Load another bead button.
- Click the Distill button to start determination of the PSF
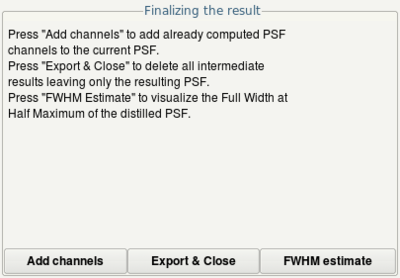
- Click the Export and Close button to finish the wizard
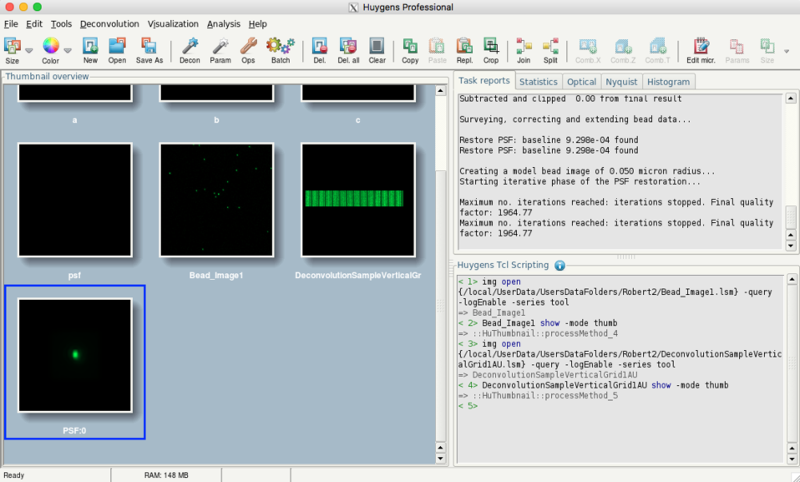
- After exporting, the PSF should be in the list of huygens data sets:
Determine good parameters for deconvolution
To determine good deconvolution parameters, it is recommended to deconvolve the bead image itself and study differences in the resulting images. Proceed like the following:
- Select the bead image
- Click the menu Deconvolution > Deconvolution Wizard
- Run the wizard by clicking the Enter wizard button
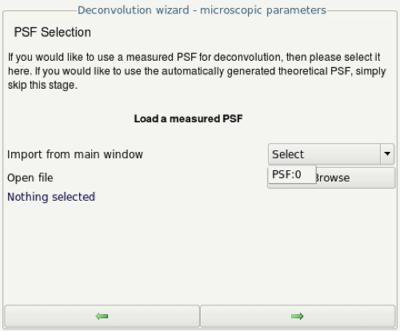
- Select the just created PSF from the pulldown
- Continue by clicking the Next button (green arrow)
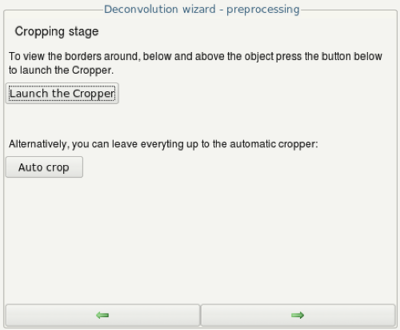
- Optionally, you can run the cropper to crop the volume which should be deconvolved. The smaller the volume, the faster the deconvolution!
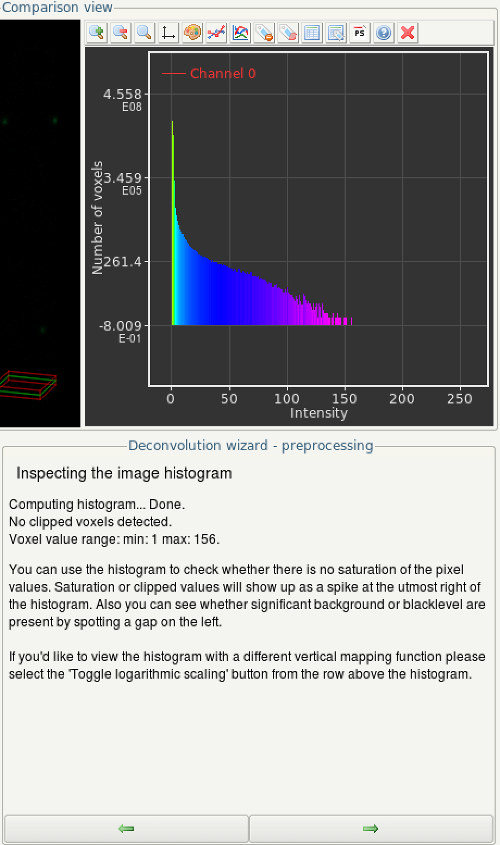
- In the next step, inspect the histogram by clicking the Compute button.
- If the height of the histogram is higher than zero on the very right of the diagram, your images are over-saturated. Continuing deconvolution is not recommended in this case.
- If the grey values do not spread to zero, something has went wrong during imaging. It is not recommended to continue deconvolution in this case.
- If the histogram looks alright (e.g. like in the example screenshot) continue by clicking the Next' button
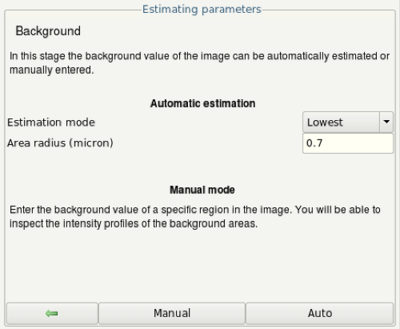
- In the next step (Background estimation) click the Manual button.
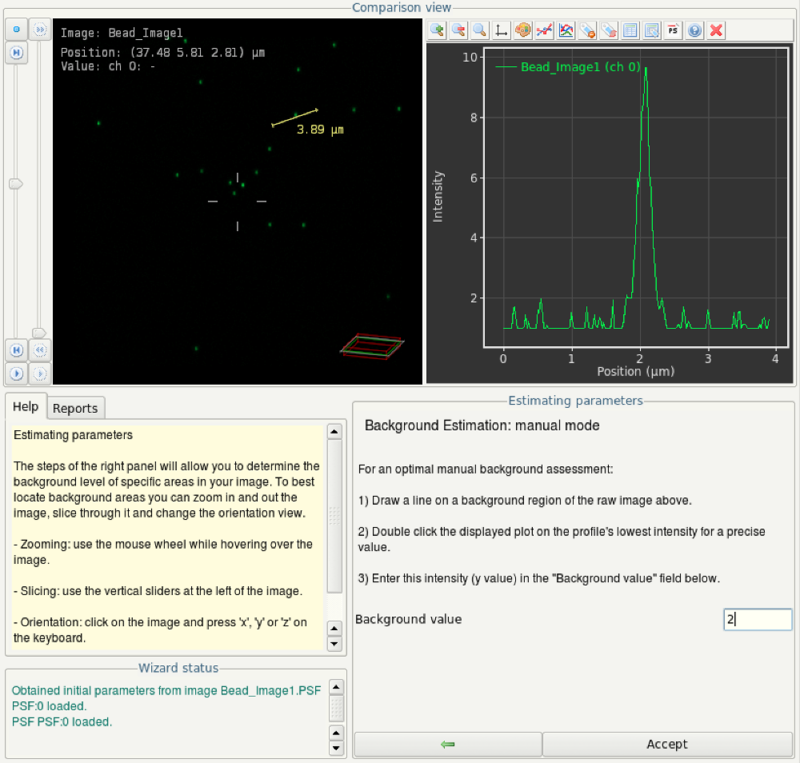
- By clicking and dragging, draw a line in the top left view. In the top right view, you will see a plot of the signal values along this line. Estimate maximum background intensity.
- In this screenshot, the line is drawn trough a bead (obvious single peak in the plot on the right). The maximum background intensity in this case is obviously 2. Enter this value as background value in the wizard and click on Accept.
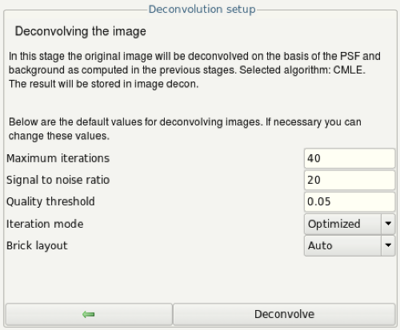
- The next steps, the deconvolution will be applied several times to try different values for the signal to noise ratio (SNR).
- The SNR is defined as the ratio between average signal intensity in the bead divided by the standard deviation in the background. Looking in the plot created during background signal estimation, we can see that the average signal in the bead is approximately 5. The standard deviation in the background may be below 1. Thus, as an initial guess, try entering a signal-to-noise ratio of 10 in this case (5 divided by 0.5).
- Click on the Deconvolve button.
- In the bottom left corner you see a log window showing the progress of the deconvolution. Usually, the maximum number of iterations is not reached. If it reaches the maximum number of iterations, try to increase the number and run deconvolution again. If you do so, compare your results. Increasing the number of iterations may be a result of insufficient image quality or other issues inhibiting proper deconvolution results.
- Click the Restart button to try another SNR configuration to do deconvolution again. Repeat the former steps with different SNR values, e.g. 20, 40 and 80.
- After you did the deconvolution several times (in the shown example using SNR 10, 20, 40, 80), click the All done button
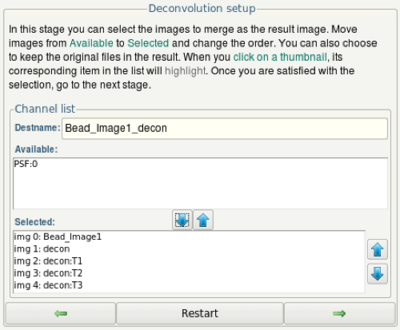
- In the final dialog, use the arrow up and down buttons to set up an image with several channels (img 0, img 1,...) containing the original image and all the deconvolved version of it. The first deconvolution result is called "decon", the second "decon:T1", the third "decon:T2" and so on.
- Click on the Next button.
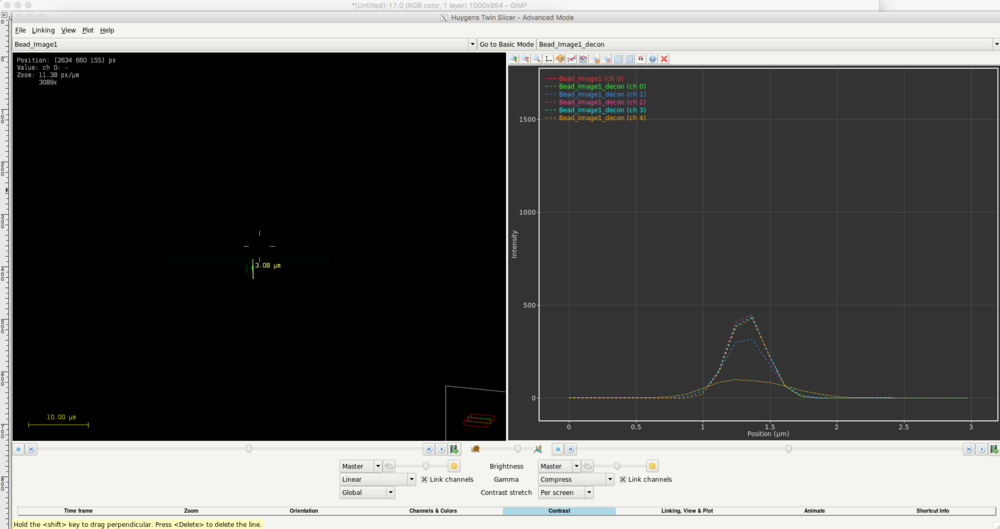
- On the next step, run the Twin slicer to inspect the resulting images.
- Select the xz plane on the bottom of the twin slicer window.
- In the left panel of the window, draw a line through a bead to plot the signal along this line. The plot will be drawn in the right panel.
- Use the magnifying glass button on top of the plot to zoom into the diagram.
- Click the color palette button to change the colors of the diagram until it looks like this:
- You will see that the signal along the line is quite different between the original image (ch 0) and the deconvolved images. Furthermore, with reaching a certain SNR, the deconvolved images do not change anymore. In this case the images calculated using SNR 20, 40 and 80 show a very similar curve. Thus, for deconvolution of images using this PSF, it is recommended to use an SNR configuration of at least 20.
Deconvolve images
- In Huygens main window, select the image which should be deconvolved.
- The example image we use here was made by imaging a slide containing flurescent vertical lines of defined distance. Between the lines, there may be background signal. If the lines are too close, the background signal may not be measured correctly.
- Click the menu Deconvolution > Deconvolution Wizard
- Run the wizard by clicking the Enter wizard button
- Select the just created PSF from the pulldown
- Continue by clicking the Next button (green arrow)
- Optionally, you can run the cropper to crop the volume which should be deconvolved. The smaller the area, the faster the deconvolution!
- In the next step, inspect the histogram by clicking the Compute button.
- If the height of the histogram is higher than zero on the very right of the diagram, your images are over-saturated. Continuing deconvolution is not recommended in this case.
- If the grey values do not spread to zero, something has went wrong during imaging. It is not recommended to continue deconvolution in this case.
- If the histogram looks alright (e.g. like in the example screenshot) continue by clicking the Next' button
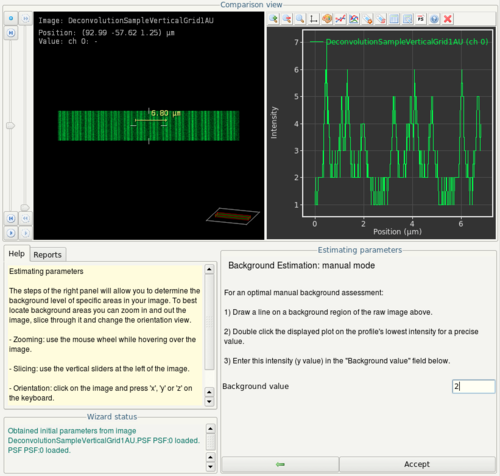
- In the next step (Background estimation) click the Manual button.
- Draw a line in your image which contains some structure (in our case vertical lines) and some background signal. From the signal plot on the right, estimate the maximum background signal. In the case presented here, we enter 2 in the input field in the bottom right corner.
- In the next step, enter the SNR value determined in the paragraph above.
- In the bottom left corner you see a log window showing the progress of the deconvolution. Usually, the maximum number of iterations is reached. If not, try to increase the number of iterations and try again.
- After you did the deconvolution several times, click the All done button.
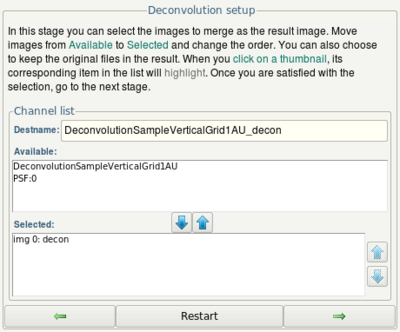
- In the next step, ensure that img 0: decon (the deconvolution result) is in the Selected list.
- Click the next button.
- In the final step, click the Done button.
Hints / best practices
- Save your data before leaving Huygens! Save PSF, deconvolved bead images and final deconvolution results. When you close and restart Huygens, the data sets from the main window will be lost!
- When saving the images, e.g. as Tif, Huygens asks if the image stacks should be split in several image files, and if the grey value range should be modified. Before closing Huygens, try if the saved images can be opened in the software you would like to use to further process them.
- When finishing the deconvolution wizard and exporting your data, we recommend to put original data set and resulting deconvolution image(s) together in one image as channels. If you don't do so, you may loose the spatial relationship between the original data set and the potentially cropped deconvolution result.
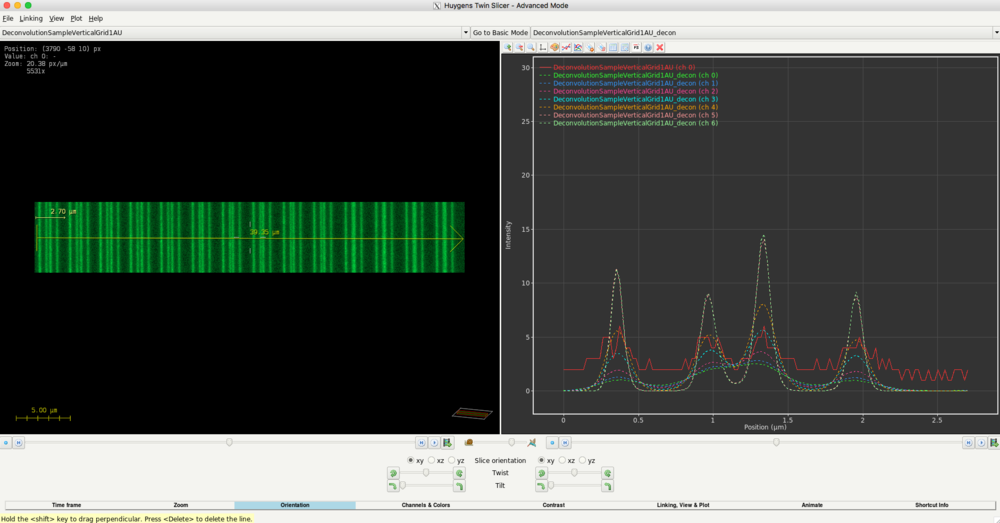
- When you apply deconvolution for the first times, we recommend to deconvolve your image data (not just the bead image) several times using different configurations (e.g. SNR) If you do so with the given example image data. You may get the following plot. In this example, the vertical lines image was deconvolved with SNR=1 (ch 0, green), SNR=2 (ch1, blue), SNR=5 (ch2, red), SNR=10 (ch3, cyan), SNR=20 (ch4, orange), SNR=40 (ch5, light red), SNR=80 (ch6, light green). When studying the plot on the right in detail, you may come to the conclusion that a higher SNR configuration (like 40) would result in more contrast between the imaged objects and the background.
- We recommend studying your data in very detail to confirm a good configuration of the deconvolution. Look out for artifacts like objects in the deconvolution result, which were not present in the original image.
