ASC Z-Resolution
From BioDIP
(Difference between revisions)
| (One intermediate revision by one user not shown) | |||
| Line 13: | Line 13: | ||
* open the image in Fiji | * open the image in Fiji | ||
** make sure the image is calibrated (use Plugins > LOCI > Bioformats Importer, if File > Open ignores the metadata) | ** make sure the image is calibrated (use Plugins > LOCI > Bioformats Importer, if File > Open ignores the metadata) | ||
| − | * draw a line over the peak (select line tool from the toolbar, left-click for start point, hold shift, left-click for end point) | + | * draw a vertical line over the peak intensity (select line tool from the toolbar, left-click for start point, hold shift, left-click for end point) |
* Analyze > Plot Profile for a rough estimation of the FWHM | * Analyze > Plot Profile for a rough estimation of the FWHM | ||
* precise analysis: save the list (button List in the profile window) and measure the FWHM in i.e. Excel | * precise analysis: save the list (button List in the profile window) and measure the FWHM in i.e. Excel | ||
| + | |||
== images == | == images == | ||
<gallery> | <gallery> | ||
| Line 21: | Line 22: | ||
file:Fiji z-resolution FWHM.jpg|Fiji: XZ-scan, Z-resolution profile | file:Fiji z-resolution FWHM.jpg|Fiji: XZ-scan, Z-resolution profile | ||
</gallery> | </gallery> | ||
| + | [[category:ASC]] | ||
__NOTOC__ | __NOTOC__ | ||
Latest revision as of 09:51, 1 October 2009
[edit] requirements
- Leica Z-resolution mirror (coverslip on top of mirror)
[edit] acquisition
- use immersion for the respective objectives
- use ~488 nm laser for illumination
- set main beamsplitter to reflection (i.e. 30/70 or 80/20 splitter, AOBS in reflection mode)
- set detection to the range of the laser wavelength (i.e. LP420, LP470, spectral detection 480-500 nm)
- close pinhole to minimum
- set acquisition to good quality (laser power high enough, line average, low scan speed, no saturated pixels)
- acquire line-stack (XZ-scan) over the reflective side
- if XZ-scan is not available: acquire XYZ-stack and reslize it afterwards in Fiji
[edit] analysis
- open the image in Fiji
- make sure the image is calibrated (use Plugins > LOCI > Bioformats Importer, if File > Open ignores the metadata)
- draw a vertical line over the peak intensity (select line tool from the toolbar, left-click for start point, hold shift, left-click for end point)
- Analyze > Plot Profile for a rough estimation of the FWHM
- precise analysis: save the list (button List in the profile window) and measure the FWHM in i.e. Excel
[edit] images
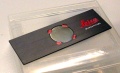
Leica Z-resolution mirror
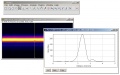
Fiji: XZ-scan, Z-resolution profile

