Advanced system check
(→Fluorescence and Brightfield Imaging) |
|||
| Line 1: | Line 1: | ||
== Fluorescence and Brightfield Imaging == | == Fluorescence and Brightfield Imaging == | ||
| − | |||
| − | |||
| − | |||
| − | |||
First step of the system check. The purpose is to test the general performance of the system: Do the basic functions work fine? Does the acquisition software behave as it should? Can one set up Koehler illumination? Are the transmitted and the reflected beam-paths ok? Although this test does not represent high-resolution work, it might reveal general problems with the system. | First step of the system check. The purpose is to test the general performance of the system: Do the basic functions work fine? Does the acquisition software behave as it should? Can one set up Koehler illumination? Are the transmitted and the reflected beam-paths ok? Although this test does not represent high-resolution work, it might reveal general problems with the system. | ||
=== requirements === | === requirements === | ||
| Line 15: | Line 11: | ||
* Is the transmitted light image free of dirt particles? | * Is the transmitted light image free of dirt particles? | ||
* Are both images free of artifacts? | * Are both images free of artifacts? | ||
| + | === images === | ||
| + | <gallery> | ||
| + | File:Conva10xok.jpg with bar.jpg|Convallaria, 10x/0.45 objective, 488 nm excitation, BP505-550 detection | ||
| + | File:Conva10xok-1.jpg with bar.jpg|Convallaria, 10x/0.45 objective, 488 nm illumination, transmitted light detection | ||
| + | </gallery> | ||
== Field Illumination == | == Field Illumination == | ||
| − | |||
The two images acquired in the first step already gave an impression of the field illumination. Homogeneous illumination is particularly important for quantitative analysis, i.e. the comparison of intensities in different regions of the field of view. Therefore the following test provides a more quantitative analysis of the field illumination. | The two images acquired in the first step already gave an impression of the field illumination. Homogeneous illumination is particularly important for quantitative analysis, i.e. the comparison of intensities in different regions of the field of view. Therefore the following test provides a more quantitative analysis of the field illumination. | ||
=== requirements === | === requirements === | ||
| Line 26: | Line 26: | ||
* focus on reflective side of mirror | * focus on reflective side of mirror | ||
* try to obtain "japanese flag" | * try to obtain "japanese flag" | ||
| + | === images === | ||
| + | <gallery> | ||
| + | file:Field illumination zeiss mirror.jpg|Field Illumination: Zeiss mirror slide | ||
| + | </gallery> | ||
== Point Spread Function (PSF) == | == Point Spread Function (PSF) == | ||
| Line 37: | Line 41: | ||
=== PSF Macro === | === PSF Macro === | ||
| − | |||
| − | |||
==== requirements for bead stacks ==== | ==== requirements for bead stacks ==== | ||
* 100 planes, 200 nm spacing | * 100 planes, 200 nm spacing | ||
| Line 98: | Line 100: | ||
picture in a JPEG format with a standardized name: Date_Scope | picture in a JPEG format with a standardized name: Date_Scope | ||
name_Magnification_NA.jpg. | name_Magnification_NA.jpg. | ||
| + | === images === | ||
| + | <gallery> | ||
| + | file:2009-09-29 MPI11 63x 1.4 FWHMa 3822nm - FWHMl 456nm.jpg|PSF macro result 1: 500 nm bead, confocal | ||
| + | file:2009-09-29 MPI11 63x 1.4 FWHMa 3822nm - FWHMl 456nm graphs.jpg|PSF macro result 2: 500 nm bead, confocal | ||
| + | </gallery> | ||
== Z-Resolution == | == Z-Resolution == | ||
| − | |||
| − | |||
=== requirements === | === requirements === | ||
* Leica Z-resolution mirror (coverslip on top of mirror) | * Leica Z-resolution mirror (coverslip on top of mirror) | ||
| Line 119: | Line 124: | ||
* Analyze > Plot Profile for a rough estimation of the FWHM | * Analyze > Plot Profile for a rough estimation of the FWHM | ||
* precise analysis: save the list (button List in the profile window) and measure the FWHM in i.e. Excel | * precise analysis: save the list (button List in the profile window) and measure the FWHM in i.e. Excel | ||
| + | === images === | ||
| + | <gallery> | ||
| + | file:Z-resolution leica mirror.jpg|Leica Z-resolution mirror | ||
| + | file:Fiji z-resolution FWHM.jpg|Fiji: XZ-scan, Z-resolution profile | ||
| + | </gallery> | ||
Revision as of 14:12, 30 September 2009
Contents |
Fluorescence and Brightfield Imaging
First step of the system check. The purpose is to test the general performance of the system: Do the basic functions work fine? Does the acquisition software behave as it should? Can one set up Koehler illumination? Are the transmitted and the reflected beam-paths ok? Although this test does not represent high-resolution work, it might reveal general problems with the system.
requirements
- basic sample with fluorescence and contrast in transmitted light (i.e. Zeiss/Leica Convallaria demo sample)
acquisition
- set up the beam-path for fluorescence and transmitted light
- use basic air objective (i.e. 10x/0.4)
- acquire two images in basic resolution (i.e. 512x512)
analysis
- Does the illumination look reasonably homogeneous over the whole field of view in both images?
- Is the transmitted light image free of dirt particles?
- Are both images free of artifacts?
images
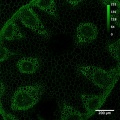
Convallaria, 10x/0.45 objective, 488 nm excitation, BP505-550 detection
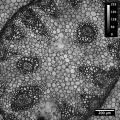
Convallaria, 10x/0.45 objective, 488 nm illumination, transmitted light detection


Field Illumination
The two images acquired in the first step already gave an impression of the field illumination. Homogeneous illumination is particularly important for quantitative analysis, i.e. the comparison of intensities in different regions of the field of view. Therefore the following test provides a more quantitative analysis of the field illumination.
requirements
- mirror slide
- alternatively: reflective surface (i.e. glass slide, gold-coated surface)
acquisition
- 80/20 mirror, 488 nm laser, pinhole 1 AU
- focus on reflective side of mirror
- try to obtain "japanese flag"
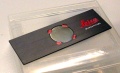
images
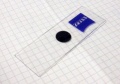
Field Illumination: Zeiss mirror slide

Point Spread Function (PSF)
- purpose:
- requirements:
- work flow:
- overlay UV/V and VIS (confocal systems with separate UV/V laser coupling)
- purpose: check the coupling precision of the UV/V laser
- requirements: 0.2/0.5µm fluorescent beads sample
- work flow: open pinhole(s), use high resolution apochromatic lens (NA 1.2 or above), acquire two images (UV/V plus VIS channel) with good sampling (pixel size ~100nm)
PSF Macro
requirements for bead stacks
- 100 planes, 200 nm spacing
- optimal: single bead in center of image
- the macro attempts to crop a 15x15 µm area with the bead in center; if the image dimensions are already smaller, extend the area: Fiji > Image > Adjust > Canvas Size...
install LUT
- Mac: go to applications folder > fiji: ctrl+click on the Fiji(.app) icon > Show package content
- PC: go to \Program Files\Fiji.app (or to the place you installed Fiji)
- create a folder called "luts", if it's not there yet
- drag and drop the *.lut into it
- (re)start fiji
install macro
- Fiji > Plugins > Macros > Install...
- select macro txt file
- macro gets installed to that menu for the current session
load bead stack
- Fiji > File > Open
- select bead stack file
- if necessary, split channels (Fiji > Image > Color > Split Channels)
- if necessary, crop image to a single bead
run macro

description by Laurent
Thanks a lot for your interest in our ImageJ Macro, which I join as an attachment.
You need to install it each time you start ImageJ. Go to >Plugins>Macros>Install...
Select it in the dialog window and click "open".
To run it, you need before to open a stack. We take stacks of 100 planes, spaced by 0.2mm, for all objectives and all microscopes. Then go to >Plugins>Macros>MIPs for PSFs for all microscopes to run the Macro.
Automatic Macro actions / User actions:
A. Selects the plane with the highest pixel intensity, adjusts display settings, opens the information dialog box.
1. Enter information in the dialog window which popped up.
2. Zoom in the image to clearly localize the center of the bead (you can also navigate between planes if needed).
3. Right clicks with the mouse on the center of the bead.
B. Crops the image to get 15mmx15mm area centered over the pixel clicked by the user.
C. Makes projections in X and Y of the stack
D. Stitches together the cropped area and the projections
E. Estimates and subtracts background
F. Takes the square root of the image (to minimize photon noise and to mimic a decrease in histogram gain)
G. Resizes the image to 550x550 pixels, adjusts display, changes LUT and saves the picture in a JPEG format with a standardized name: Date_Scope name_Magnification_NA.jpg.
images
PSF macro result 1: 500 nm bead, confocal
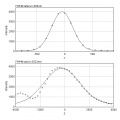
PSF macro result 2: 500 nm bead, confocal


Z-Resolution
requirements
- Leica Z-resolution mirror (coverslip on top of mirror)
acquisition
- use immersion for the respective objectives
- use ~488 nm laser for illumination
- set main beamsplitter to reflection (i.e. 30/70 or 80/20 splitter, AOBS in reflection mode)
- set detection to the range of the laser wavelength (i.e. LP420, LP470, spectral detection 480-500 nm)
- close pinhole to minimum
- set acquisition to good quality (laser power high enough, line average, low scan speed, no saturated pixels)
- acquire line-stack (XZ-scan) over the reflective side
- if XZ-scan is not available: acquire XYZ-stack and reslize it afterwards in Fiji
analysis
- open the image in Fiji
- make sure the image is calibrated (use Plugins > LOCI > Bioformats Importer, if File > Open ignores the metadata)
- draw a line over the peak (select line tool from the toolbar, left-click for start point, hold shift, left-click for end point)
- Analyze > Plot Profile for a rough estimation of the FWHM
- precise analysis: save the list (button List in the profile window) and measure the FWHM in i.e. Excel
images
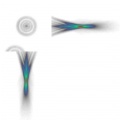
Leica Z-resolution mirror
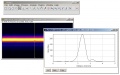
Fiji: XZ-scan, Z-resolution profile

