Gallery
(→2005) |
|||
| Line 88: | Line 88: | ||
==== 2005 ==== | ==== 2005 ==== | ||
<gallery perrow=4> | <gallery perrow=4> | ||
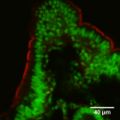
| − | Image:DSCN3198.JPG | | + | Image:DSCN3198.JPG | sampling |
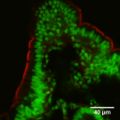
| − | Image:DSCN3203.JPG | | + | Image:DSCN3203.JPG | up to 4 years, simplified |
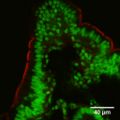
| − | Image:DSCN3205.JPG | | + | Image:DSCN3205.JPG | cribs |
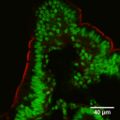
| − | Image:DSCN3208.JPG | | + | Image:DSCN3208.JPG | final test |
</gallery> | </gallery> | ||
Revision as of 13:22, 8 September 2009
Contents |
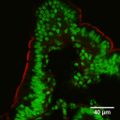
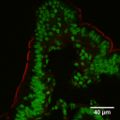
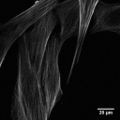
Images acquired with our equipment
Effect of the CLSM pinhole
overview images
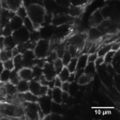
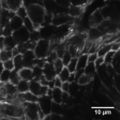
- Typical overview image of a tissue sample region. Pinhole diameter decreases from 8 airy units to 1 airy unit.
- Available as Video
8 Airy Units

7 Airy Units
6 Airy Units

5 Airy Units
4 Airy Units
3 Airy Units
2 Airy Units
1 Airy Unit


- Invitrogen FluoCells(r) #4, Zeiss LSM 510, Plan-Apochromat 63x/1.4, 488 nm + 594 nm excitation, 505-580 nm + LP610 nm detection
XY
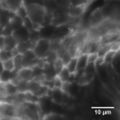
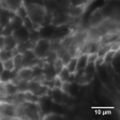
- High resolution image, acquired with decreasing pinhole diameter from 8 airy units to 0.6 airy units.
- Available as Video
8 Airy Units
7 Airy Units

6 Airy Units
5 Airy Units
4 Airy Units
3 Airy Units
2 Airy Units
1 Airy Unit
0.8 Airy Unit

0.6 Airy Unit


- Invitrogen FluoCells(r) #4, Zeiss LSM 510, Plan-Apochromat 63x/1.4, 594 nm excitation, LP610 nm detection
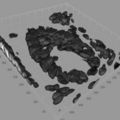
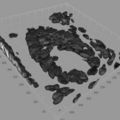
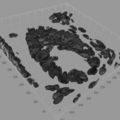
XYZ
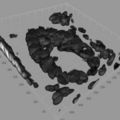
- One region of the sample was imaged with decreasing pinhole diameter, starting from 8 airy units (first image) down to 1 airy units (last image).
- Available as Video
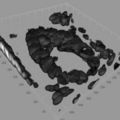
8 Airy Units

7 Airy Units
6 Airy Units

5 Airy Units
4 Airy Units
3 Airy Units
2 Airy Units

1 Airy Unit


- Invitrogen FluoCells(r) #4, Zeiss LSM 510, Plan-Apochromat 63x/1.4, 488 nm excitation, 505-580 nm detection, 0.2 µm Z-stepsize, Bitplane Imaris
Cleaning an objective makes sense
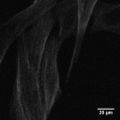
w/o lens cleaning
w/ simple lens cleaning (2 wipes with Whatman(r) paper and 70% EtOH)


- Invitrogen FluoCells(r) #6, Zeiss LSM 510, Plan-Apochromat 63x/1.4, 488nm excitation, 505-550nm detection, pinhole @98µm
Photos
Peter Evennett
"Principles of Light Microscopy" course 2007
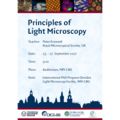
course announcement
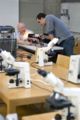
Peter Evennett and Humberto at the optical bench
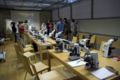
room overview - 2nd floor galeria
Peter at his demo microscope
it's all about lenses
Jan
the optical bench
Peter at the condenser
demonstration of refractive index with a cup, a coin and water
Peter Evennett
Peter & Peter, setting up the demo microscope
Tim Cross, finally at the pipette


PhD Course
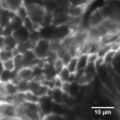
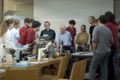
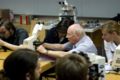
2005
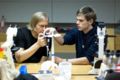
sampling
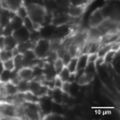
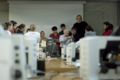
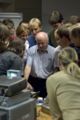
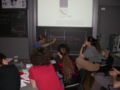
up to 4 years, simplified
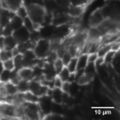
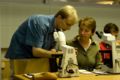
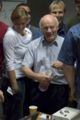
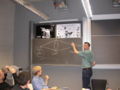
cribs
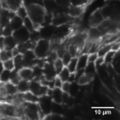
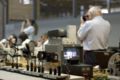
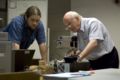
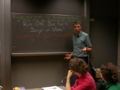
final test


