Chromatic aberration measurement and correction
From BioDIP
(Difference between revisions)
| Line 6: | Line 6: | ||
* pinhole registration: on systems with multiple pinholes such as the Zeiss LSM 510, one might run into the additional trouble of pinhole alignment; if the pinholes are not well registered to each other, signals get displaced | * pinhole registration: on systems with multiple pinholes such as the Zeiss LSM 510, one might run into the additional trouble of pinhole alignment; if the pinholes are not well registered to each other, signals get displaced | ||
Now it's clear that several combinations of acquisition settings should be tested. A good start is a stack of 3 colors (RGB, i.e. EX 405, 488, 561 nm) with open pinhole(s). | Now it's clear that several combinations of acquisition settings should be tested. A good start is a stack of 3 colors (RGB, i.e. EX 405, 488, 561 nm) with open pinhole(s). | ||
| − | + | == requirements == | |
| − | * | + | * 0.2 or 0.5 µm fluorescent beads sample |
| − | + | == acquisition == | |
| − | + | * open pinhole(s) | |
| − | * | + | * use high resolution apochromatic objective (NA 1.2 or above) |
| + | * set up beam path for Z-stack RGB fluorescence (i.e. EX 405, 488, 561 nm) | ||
| + | ** take care of pixel size and Z-step size (optimal sampling, i.e. pixel size 100 nm, step size 200 nm) | ||
| + | ** do not oversaturate pixels, rather go for 12/16 bit | ||
| + | ** use sequential line-by-line scanning, to reduce both bleed-through and influence of stage/system vibrations | ||
| + | ** set the margins of the stack to cover the beads and the majority of the point spread function | ||
| + | ** stay in the center of the field of view (optimal performance of scanner and objectives) | ||
| + | * acquire stack of images | ||
| + | == analysis == | ||
| + | * load the acquired stack into Fiji | ||
| + | * select the main focal plane | ||
| + | * draw a horizontal line with the line tool across a single bead close to the center; the line can be moved around with the arrow keys | ||
| + | * go to Analyze > Plot Profile | ||
| + | * go to the next channel w/o changing the line and plot another profile | ||
== images == | == images == | ||
<gallery> | <gallery> | ||
Revision as of 11:23, 1 October 2009
One main issue in multi-color imaging is the precise overlay of the single channels. This becomes especially important for pixel-precise colocalization analysis. Therefore this test does make most sense for high resolution objectives. Several points are to consider for a perfect overlay of colors:
- coupling of the lasers: often "UV" and "VIS" lines have separate couplings due to the necessity for different fibers; the coupling precision influences the registration of "UV" and "VIS" lines
- collimator lenses: various systems allow to further influence the overlay of "UV" and "VIS" via collimator lenses
- objective corrections: the level of correction for chromatic abberations varies between objectives
- objective damages: the correction of objectives can be ruined by objective damages
- pinhole registration: on systems with multiple pinholes such as the Zeiss LSM 510, one might run into the additional trouble of pinhole alignment; if the pinholes are not well registered to each other, signals get displaced
Now it's clear that several combinations of acquisition settings should be tested. A good start is a stack of 3 colors (RGB, i.e. EX 405, 488, 561 nm) with open pinhole(s).
requirements
- 0.2 or 0.5 µm fluorescent beads sample
acquisition
- open pinhole(s)
- use high resolution apochromatic objective (NA 1.2 or above)
- set up beam path for Z-stack RGB fluorescence (i.e. EX 405, 488, 561 nm)
- take care of pixel size and Z-step size (optimal sampling, i.e. pixel size 100 nm, step size 200 nm)
- do not oversaturate pixels, rather go for 12/16 bit
- use sequential line-by-line scanning, to reduce both bleed-through and influence of stage/system vibrations
- set the margins of the stack to cover the beads and the majority of the point spread function
- stay in the center of the field of view (optimal performance of scanner and objectives)
- acquire stack of images
analysis
- load the acquired stack into Fiji
- select the main focal plane
- draw a horizontal line with the line tool across a single bead close to the center; the line can be moved around with the arrow keys
- go to Analyze > Plot Profile
- go to the next channel w/o changing the line and plot another profile
images
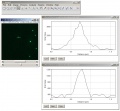
quick & dirty coregistration analysis in Fiji, 200 nm beads, 2 line profiles (X-direction) for "blue" and "green"
